After reading the lecture and text book assignment, visit the Google analytics for business page and pick out which features you think would be the most beneficial to your business to check regularly and why, then write a blog post with this information.
For my business of leads generation I would first and foremost need to develop a quality product and informational service for those seeking fresh, quality data at an affordable, competitive rate.
I would then try to develop useful content for those not only looking for a place to supply them with leads but to also acquire additional information for them to use.
Valuable information that shows each lead type psychographics, and behavioristic demographics to help them strategize more effectively and convert lead prospects to paying customers so they come back to my site for more.
Hopefully this strategy of sharing valuable content on multiple social media platforms would attract those wanting to link with me which would help grow my authority quotient.
So to know where, when, how, why and what attracts those to my site, I would use these Google analytic tools to begin with and expand from there.
• Advertising & Campaign Performance - Campaign Measurement
• Advertising and Campaign Performance - SEO Reports
• Audience Characteristics and Behavior - Traffic Sources
• Audience Characteristics & Behavior - Mobile Traffic
• Social - About Social Plug-in Analytics
• Audience - New vs Returning Users
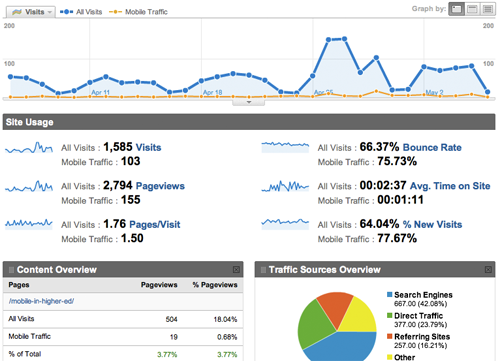
• Analysis and Testing - Dashboards
• Advertising and Campaign Performance - Campaign Measurement:
 See which of your marketing campaigns are really paying off with this detailed
real-time report. Engagement and conversion activity are included for any link
you tag (even on email and banners) and can be segmented by channel. Offline
campaigns that send users to your site can also be measured.
Learn more - Help center article / Blog Post
See which of your marketing campaigns are really paying off with this detailed
real-time report. Engagement and conversion activity are included for any link
you tag (even on email and banners) and can be segmented by channel. Offline
campaigns that send users to your site can also be measured.
Learn more - Help center article / Blog Post • Advertising and Campaign Performance - SEO Reports:
 With the SEO reports in Analytics, you can easily compare Google Web
Search impressions and clicks for your site to other traffic source data
from Analytics, such as paid AdWords impressions and clicks. By
identifying the Google Web Search queries that drive traffic to your
site, you can also learn which AdWords keywords make the most sense for
your business objectives. In addition, you can identify how to optimize
your website for both content and search quality.
With the SEO reports in Analytics, you can easily compare Google Web
Search impressions and clicks for your site to other traffic source data
from Analytics, such as paid AdWords impressions and clicks. By
identifying the Google Web Search queries that drive traffic to your
site, you can also learn which AdWords keywords make the most sense for
your business objectives. In addition, you can identify how to optimize
your website for both content and search quality. Learn more - Help center article
• Audience Characteristics and Behavior - Traffic Sources:
How do people find your site? Use Traffic Sources to evaluate the effectiveness of your referrals, direct traffic, organic (unpaid) search keywords, and custom campaigns. Learn more - Help center article
• Audience Characteristics & Behavior - Mobile Traffic:
Should you build a separate mobile site, create a mobile app or implement responsive design? As mobile continues to boom and consumer preferences shift, the Mobile Traffic report helps you analyze and optimize for success.
Learn more - Help center article
See infographics on MOBILE MARKETING and RESPONSIVE DESIGN at end of blog
• Social - About Social Plug-in Analytics:
 If you have Google+ "+1" and Facebook "Like" buttons on your site, it's
important to know which buttons are being clicked and for which content.
For example, if you publish articles on your site, you'll want to know
which articles are most commonly "liked" or shared, and from which
social networks they're being shared (for example, Google+ or Facebook).
You can use this information to create more of the type of content
that's popular with your users. Also, if you find that some buttons are
rarely used, you may wish to remove them to reduce clutter. Learn more - Help center article
If you have Google+ "+1" and Facebook "Like" buttons on your site, it's
important to know which buttons are being clicked and for which content.
For example, if you publish articles on your site, you'll want to know
which articles are most commonly "liked" or shared, and from which
social networks they're being shared (for example, Google+ or Facebook).
You can use this information to create more of the type of content
that's popular with your users. Also, if you find that some buttons are
rarely used, you may wish to remove them to reduce clutter. Learn more - Help center article • Audience - New vs Returning Users:
 This report gives you a quick look at the ratio of new to returning users by number of sessions and percentage of sessions. You can see the relative economic impact of new vs returning users by
viewing the Ecommerce statistics and adding Segments for New and
Returning Users. When you segment the report this way, you get
side-by-side statistics for things like overall revenue, the number of
transactions, and the average value of each transaction for each
population. Learn more - Help center article
This report gives you a quick look at the ratio of new to returning users by number of sessions and percentage of sessions. You can see the relative economic impact of new vs returning users by
viewing the Ecommerce statistics and adding Segments for New and
Returning Users. When you segment the report this way, you get
side-by-side statistics for things like overall revenue, the number of
transactions, and the average value of each transaction for each
population. Learn more - Help center article • Analysis and Testing - Dashboards:
 Dashboards give you a summary of many reports on a single page. Start with a
dashboard with your most important performance indicators (your "Company
KPIs"), then create detailed dashboards for other important topics like search
engine optimization. Dashboards use drag-and-drop widgets for fast, easy
customization. Learn more - Help center article
Dashboards give you a summary of many reports on a single page. Start with a
dashboard with your most important performance indicators (your "Company
KPIs"), then create detailed dashboards for other important topics like search
engine optimization. Dashboards use drag-and-drop widgets for fast, easy
customization. Learn more - Help center articleAs things progress and I understand more of what's out there, these are but a few of Google's analytic tools that I would be using.
MOBILE MARKETING and RESPONSIVE DESIGN

No comments:
Post a Comment